


Integral to their investment strategy, treasurers have to find the balance between the company’s requirements in relation to security, liquidity and yield. The investment challenge, though, has greatly increased due to low prospective returns, coupled with elevated risk. The pandemic has led to many companies needing to reassess their objectives and revisit the structure of their investment portfolios, the size of which may have increased dramatically. The pandemic is not over, but while the dust appears to be settling to a certain degree, investors remain cautious and risk judgements remain elevated – especially as regulatory frameworks are once again shifting.
Key practicalities
- Gaining insight into the cost of cash and the financial market’s view of the economy;
- Setting out the criteria for counterparty selection and limiting exposure to risk of loss; and
- Ensuring the governance framework continues to be fit for purpose and proactively identifying trigger events for further review.
Yield
Yield curves are among the most important pieces of market information that treasurers have at their disposal. The yield curve is a graphical representation of the relationship between the yield and the term to maturity offered in the market by fixed interest rate investments. Yields are largely affected by market views of interest-rates during the lifetime of the instrument. The most usual yield curve is one in which short-term instruments have a lower yield than long-term instruments of the same credit quality. This gives the yield curve an upwards slope and is called a Normal or Positive yield curve, as illustrated in figure 1 below.

Less usual is the Inverted yield curve, illustrated below in figure 2, which slopes downwards, and is hence sometimes referred to as a Negative yield curve. This type of curve occurs when long-term debt instruments have a lower yield than short-term debt instruments of the same credit quality.

When short-term interest rates exceed long-term rates, traditional wisdom suggests that it reflects market-trading sentiment that the long-term outlook is poor, and interest rates are expected to fall.
Traditional markets have been distorted by the significant and prolonged levels of quantitative easing in many major economies, and although the yield curve reflects the market price for debt of varying maturities, it may or may not correlate with forecasts for future rates based on fundamentals. Historically, inverted yield curves are short-lived and self-correcting as demand for longer maturities pushes the yields up.
In recent years, we have also seen an almost flat yield curve, where interest rates in certain economies were near or even below 0%, and longer maturities were offering almost imperceptibly higher rates.
Yield curves are useful to:
- Shed valuable insight into the financial market’s view of the economy in general, as the yield curve is essentially a representation of the cost of cash through time;
- Cross-check the future rates implied by the yield curve against market interest-rate forecasts and against the company’s own forecasts;
- Identify instruments that may be mispriced (ie their yield is inconsistent with the yield curve for some reason), thereby possibly presenting an opportunity to enhance returns; and
- Assist in pricing new investment opportunities. Yields on instruments at given maturities, adjusted for any risk premium, give a good guide as to the market’s interest in any new bond issues by similar companies.
Note: Forecasts of interest rates together with yield curves are often available free of charge from the banks or from reputable internet sites.
Investment strategies
The investment policy will influence the type of investment strategy the treasurer can use for investing short-term surpluses. The main investment strategies are:
Passive: the cash manager minimises risk, and thereby sacrifices some return, by keeping the investments very liquid and short term. Example of passive investing are sweep accounts and automatic overnight investment vehicles in which balances left in the bank account at the end of the day are automatically invested by the bank overnight and returned to the account the next day.
Active: aims to increase returns by taking an active role and investing more aggressively but also accepting more risk. Riding the yield curve is an active strategy that seeks to take advantage of the current yield curve and mismatches the maturity to improve yield. For example, in a normal yield-curve environment, if a cash surplus is available for three months but the interest rate for six months is higher, the treasurer makes a six-month investment and sells the instrument after three months. This strategy, however, is risky. If the yield curve rises, the value of the investment goes down and there will be a loss of principal on sale. There is usually both market and price risk with active strategies. In the cash management context, using an aggressively active strategy is unusual, and should be tightly controlled.
Hybrid: combines elements of both passive and active strategies. Within the constraints of the investment policy, particularly concerning security of principal, the cash manager invests in the instruments and the maturities, which optimise liquidity and investment returns. Typically, a proportion is managed passively and ‘kept short’ to provide immediate liquidity (operating cash) and to accommodate day-to-day fluctuations, while the balance is managed so as to obtain the optimum return (liquidity reserves).
Credit risk
Assessing credit risk
One of the major risks to consider when making an investment decision is the creditworthiness of the borrower and likelihood of repayment of the principal and interest. Credit rating agencies (CRAs) can evaluate the borrower and many of the instruments used to raise funds such as commercial paper, bonds and money market funds.
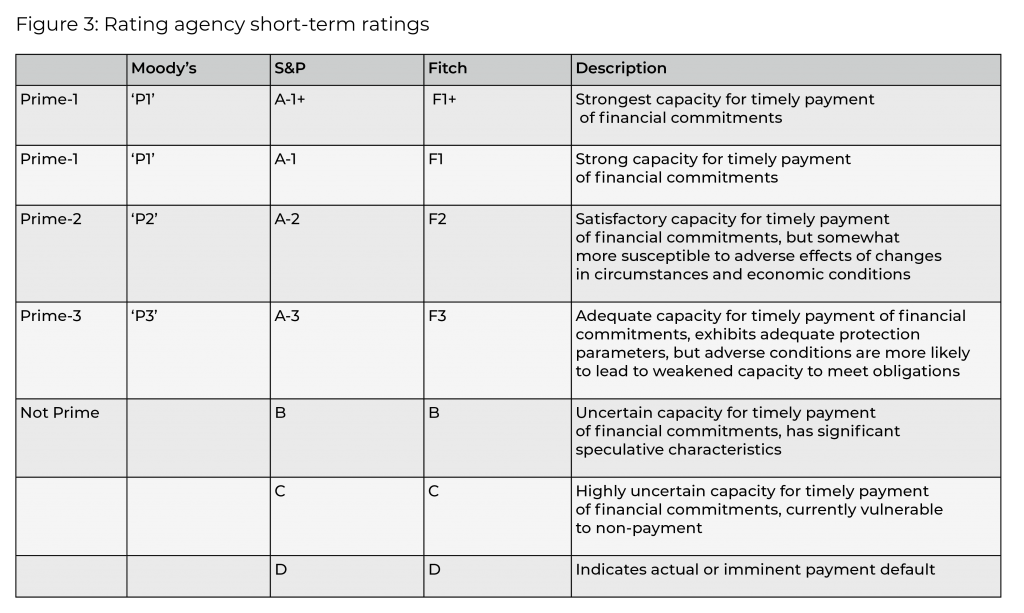
Short-term ratings are a measure of the ability of the borrower to repay short-term obligations of up to 12 months. The short-term ratings focus more on an obligor’s liquidity profile and capacity to meet their obligations when they fall due. Obtaining higher ratings for short-term debt is easier, although strong long-term credits would normally also achieve higher short-term credit ratings.
For reference, figure 3 below shows the comparison of short-term ratings used by the three major rating agencies: Moody’s, Standard & Poor’s (S&P) and Fitch. The agencies all apply different criteria for their ratings, as shown in the table, which indicates comparative ranges, rather than exact equivalents between the categories. In some countries the agencies may also align their terminology to conform to the local standard.
Note: As the agencies perform their own analysis, the same instrument or issuer may be rated differently by different agencies.
One of the major drawbacks of relying on ratings is that they change infrequently, and are hence perceived to be slow to react to new information, and may not necessarily reflect market sentiment. Increasingly, therefore, investors are also using credit default swap (CDS) prices to evaluate credit risk. CDS prices measure pure risk in basis points, and because CDSs are traded in the market, prices are current and reflective of all current publicly available information on the underlying security. Essentially, the higher the CDS price, the greater the credit risk perceived by the market. However, CDS pricing is not perfect, as it can, for instance, be affected by sentiment over hard facts. But it is a useful complement to ratings information.
Assessing liquidity
Liquidity refers to the depth of a particular market. When an investor looks to sell an instrument, is there enough activity so that buyers can be readily found? As a rule of thumb, the more liquid an instrument, the lower the yield (as there is more demand for it). Higher-rated investments, such as government-issued securities, are also usually very active in the so-called secondary market, which refers to the buying and selling of pre-existing investor commitments to other investors, including private equity and other alternative investment funds.
Assessing returns
The return on an investment depends on many factors. Treasurers need to be aware of the characteristics of the various investment options, and how the return is calculated in order to be able to compare the yields. There are three principal ways in which interest is calculated on investment instruments. These are:
1. Coupon or simple interest: refers to specific interest payments that are made at specified times. The term ‘coupon’ originated when interest was claimed by clipping a specific coupon for a particular payment date (the coupon was attached to the certificate) and cashing the coupon at the bank. Simple interest is usually the basis used for bank deposits and gilt‐edged securities (government debt).
The formula for calculating yield on a coupon instrument is:
Yield = (interest at maturity/amount invested) x (year basis/days)
Interest at maturity = principal amount x interest rate x (days/year basis)
= 100,000 x 0.001 x (365/360) = 101.39
Yield = (101.39/100,000) x (360/365) = 0.001000 = 0.100%
Note that the interest rate and the yield for a coupon instrument are the same.
2. Discount: refers to instruments that are issued for a nominal value but sold to investors at a discounted amount. The return is paid by repaying the nominal value at maturity. The discount basis is often used for treasury and bank bills, as well as for US commercial paper (CP).
Return on 2% discount investment instrument of $100,000 for one year:
The formula for calculating yield on a discount instrument is:
Yield = (discount amount/price paid) x (year basis/days)
Discount amount = face value x discount rate x (days/year basis)
= 100,000 x 0.02 x (365/360) = 2,027.78
Price paid = face value − discount amount
= 100,000.00−2027.78 = 97,972.22
Yield = (100,2027.78/97972.22) x (360/365) = 1.02713 = 2.713%
Note that with a discount instrument the yield is higher than the nominal discount rate.
Discount yield using annualised percentage rates: if the discount rate is expressed as an annualised percentage, a shorthand calculation is used:
Yield = discount rate/ {1 − (discount rate x (days/year basis))}
Discount yield when the discount is expressed as a periodic rate: usually interest rates are expressed as annualised rates, but for some instruments a discount (or premium) is expressed as a periodic interest rate, ie, the rate that will be earned on the investment for the period of time to maturity. In this case, the discount rate represents the return for the specific period of time and is not an annualised rate. Traditionally, bank bills are quoted using periodic interest rates.
3. Compound interest or yield to redemption: relates to investments in which a number of interest payments are made during the lifetime of the instrument, rather than in a lump sum at maturity, and takes the impact of compounding into the overall yield. The assumption is that any interest paid can be reinvested at the same rate, thus increasing overall return. This is generally used for longer‐term debt issues. Note that in some markets, some investment instruments are quoted on a price basis, ie the instrument is bought and sold at the quote’s prevailing market price. An instrument quoted at 100 is priced at ‘par’, ie market value equals future (maturity) value. An instrument quoted at less than 100 is at a discount, whereas one quoted at over 100 is at a premium. Because these are considered capital gains rather than interest, it may prove to be tax-effective for some companies. The yield calculations, however, are the same as for the interest‐based yields above.
Whichever way the interest is computed, what is ultimately important to an investor is the overall return, or yield, on an investment, which is a function of:
- The cash flows from the investment;
- The initial amount paid for the investment;
- The maturity or holding period; and
- The tax basis.
In order to calculate the return on an investment instrument of €100,000 for one year that pays 10% p.a., paid quarterly, the formula for calculating periodic compound interest is:

Note: The yield on an instrument paying interest on a compound basis is higher than the yield on a coupon or simple interest basis.
Comparing investment returns
When comparing returns on different investments, one needs to understand the exact characteristics of the investment instrument, and how the overall yield is computed. The number of days for which interest calculations are performed and the convention used for the year basis impacts the return to the investor. Conventions concerning the day basis and year basis differ by instrument and by country. Figure 4 below provides a guide to some of the market conventions that are currently used.
Note: These vary from market to market, and treasurers need to be certain of the precise conventions applied, in order to accurately compare the return on investments under consideration.
Figure 4: Interest rate conventions
By; convention days/basis, characteristics, used by and comments
Actual/Actual:
- Interest is calculated using the actual number of days in the interest period and the actual number of days in the year as a year basis.
- Used by:
- Most Eurobond issues;
- GBP bonds;
- US treasury bonds; and
- Some USD interest-rate swaps.
- Used for coupon/simple interest instruments in the US.
- In a leap year the basis will be 366 days. Other years would have 365 days.
- Also known as the bond equivalent yield or BEY.
Actual/365:
- Interest is calculated using the actual number of days in the interest period and a fixed 365‐day year basis.
- Used by:
- GBP interest rates money market in Canada, Australia and New Zealand.
- Even in leap years the year basis is 365 days.
Actual/360:
- Interest is calculated using the actual number of days in the interest period and a fixed 360‐day year basis.
- Used by:
- Most floating rate notes (FRNs);
- Many euro deposits/borrowings;
- Discount instruments in the US such as T‐bills and CP; and
- Not used in the UK for FRNs.
- A one‐year deposit, therefore, earns interest at [rate %] x 365/360.
- The impact of the extra five days is reflected in the rate %.
- Also known as the money market or CD equivalent yield.
30/360:
- Interest is calculated as if every month has 30 days, and thus has a fixed 360-day year basis.
- Used by:
- US Federal Agency and corporate bonds;
- Eurobonds;
- Swiss bonds; and
- Swedish bonds.
- Called the bond basis.
- Mainly used for instruments with standardised monthly maturities.
Note: The above conventions have been provided for your information and to illustrate the wide variety of bases used for different instruments and thus the importance of understanding exactly what basis has been used in order to be able to compare yields.
Comparing yields
Following on from the previous calculation examples, three instruments quoted at 10% for one year yielded very different returns.
- Coupon yield was 10%;
- Discount yield was 11.13%; and
- Yield on an instrument paying interest compounded quarterly was 10.38%.
Investing in the secondary market
When buying or selling an investment in the secondary market (before the maturity date), the treasurer will need to calculate the proceeds. Proceeds refer to how much the instrument is worth at the current rates. From an investor’s perspective, proceeds refer to the amount the investor will have to pay to buy that instrument in the secondary market. The formula for calculating proceeds is:
Where future value = principal amount + interest at maturity

Comparing instruments on a different year basis
- Converting an instrument calculated on a year basis: 360 days to a 365-day-year basis, the formula is: Rate x (365/360)
- Converting an instrument calculated on a year basis: 365 days to a 360-day-year basis, the formula is: Rate x (360/365)