


Key practicalities
- Determine the amount of cash available for short-, medium- and long-term investments;
- Invest in medium- and long-term investments with confidence; and
- Understand the objectives, methods to construct a cash forecast, data generation and feedback procedures to gradually increase forecasting accuracy.
Objectives
A good forecast is an essential tool in managing a company’s liquidity, not just for short-term, day-to-day cash management, but also for medium-term investment and borrowing. Forecasting is instrumental in managing risks, enhancing returns and maintaining financial controls, as it allows treasurers to anticipate cash movements and levels, enabling them to take any necessary action.
Cash-forecasting tools range from the simple spreadsheet to sophisticated computer models, in some cases integrated into a company’s enterprise resource planning (ERP) system. The chosen technique used must be appropriate, reliable, accurate and considerate of behavioural considerations.
During times of market crisis, good practice is even more important in cash-flow forecasting, where treasurers should establish real-time visibility into cash positions and establish adequate buffers to manage shortfalls. The pandemic made cash-flow forecasting complicated, but at the same time also more important, where treasurers spent considerable parts of their time planning and forecasting.
The levels of excess or shortfalls at various points in time, versus plan/baseline/zero balance, need to be ascertained to have a good grasp on the period for which funds are available or would need to be raised. Poor forecasting can be costly, as it may lead to unnecessary borrowing (if sufficient investments cannot be liquidated), or in the worst case, corporate failure if the company is unable to pay a critical payment (for example, to a core supplier or to a bondholder).
Cash forecasting can be an invaluable tool, but only useful if it is:
- Prepared using reliable data;
- Produced using time horizons appropriate to the purposes it is being used for;
- Regularly updated to reflect changes, or known future events; or
- Checked against actual numbers and refined by feeding back to contributors over time to improve accuracy.
Short- and medium-term forecasting techniques
Operational cash forecasts are short term, which generally covers the next 13 weeks on a rolling basis. They will be updated regularly (during the height of the pandemic some organisations were doing so twice a week), which may be weekly or monthly depending on the industry and economic circumstances. Operational forecasts are used for cash positioning, whereas medium-term forecasting is more strategic and used to manage longer-term funding or investment requirements. In times of crises, short- and medium-term forecasting will be difficult given the levels of uncertainty. During the COVID-19 pandemic, treasurers confirmed their difficulties to forecast even over the next four weeks out.
Under normal circumstances, short-term (and sometimes medium-term) cash-flow forecasting can usually be conducted with a reasonable degree of accuracy. The forecast can be built up from actual accounts payable and receivable data, expected receipts and disbursements, together with an analysis of past trends or patterns of behaviour. That is the science part of it, but forecasting is also partly an art form, since the future is rarely a carbon copy of the past, leaving plenty of room for judgement.
Size and complexity of the organisation can also come into play. Smaller businesses are ‘closer’ to the business and will be able to build a forecast in a relatively straightforward manner without requirements for much additional information. The larger the organisation, the less a treasurer will know about the business. In that case, their role will be to consolidate forecasts rather than building them, as their knowledge of the business and the cash drivers will not be as extensive. Having said that, larger organisations are likely to be able to invest more in systems and can model outcomes on the basis of trends underpinned by large amounts of data.
The human factor needs to be considered in the accuracy of forecasts. The various sources of information may be skewed to a more optimistic or pessimistic view of the reality, in an attempt to protect budgets and/or sales targets.
The following techniques are used for both short-term and medium-term forecasting, as they can be used just as effectively for intraday forecasting as for periods of up to one year. Companies will almost certainly use a combination of methods, and prepare a number of different forecasts, depending on the purpose of the forecast, the data available and the tools that can be used.
Receipts and disbursements model
The receipts and disbursements model predicts the amount of cash receivable and payable within the forecast period. This can cover a day, a week or a month. The objective here is to predict short-term cash flows as accurately as possible. Preparing the forecast starts with the creation of a separate schedule for receipts and for payments.
Receipts include:
- Cash sales to customers;
- Receipts from debtors;
- Income and dividends from investments;
- Proceeds from the sale of assets;
- Any recovered taxes, such as value added tax (VAT);
- Royalties; and
- Rents received.
Payments include:
- Cash purchases;
- Payments to trade creditors;
- Payment of operating expenses, for example, manufacturing, wages, sales and marketing costs;
- Interest payable on loans and debt repayments;
- Purchase of any assets;
- Tax payments;
- Dividends, royalties; and
- Lease payments.
Corporates can add a minimum cash balance to cover unforeseen circumstances, or seek to run cash at zero/overdrawn position. Once the payments and receipts schedules have been prepared, the forecast is compiled period by period, showing a surplus or deficit position at the end of each period.
For accuracy, any data used in the forecast must be carefully monitored, compared to actual and adjusted. This cyclical process is crucial to ensure constant improvement and, where needed, identify consistent errors (high- and/or low-balling) on the part of the data providers. Working closely with the receivables team will provide accurate estimates of receipt patterns, which may experience regular peaks, such as end-of-the-month customer bill payments and company disbursements. Good communication between treasury, accounting and the business units is critical to capture any irregular or one-off large receipts or payments.
Statistical methods
A number of statistical methods are used to forecast receipts and payments. These range from the very simple moving average to the distribution method and regression analysis.
The moving average is one of the most-used statistical techniques and consists of using historical data to base a forecast on a rolling or moving average of the most recent values. The moving average provides a historical trend, which is then used to project forward into the future. A forecast based on historical data obviously captures past trends rather than current or expected trends and will, therefore, lag any trend in actual cash flow. No weighting is used and all observations (data points) count equally.
This technique is not particularly helpful during a period of extreme or sudden change – the COVID-19 pandemic being a classic example. The variation in periods of lockdown, occurring in different parts of the globe at different times, proved particularly difficult for treasurers trying to manage working capital and liquidity. Providing historical trends is therefore impossible, and the treasurer is left surrounded by uncertainty, unable to estimate or consolidate the varying and complex situation. They can forecast best- and worst-case scenarios, gauging what headroom is needed, and any additional sources of finance they might need to fund shortfalls.
Exponential smoothing: The moving average forecast can be adjusted for trends by using more observations to calculate the average. If this does not improve the accuracy of the forecast, then the result may be adjusted using ‘smoothing’. Exponential smoothing takes simple moving averages and adjusts them so that more weight is either placed on the recent observations or on the historical data. Exponential smoothing seeks to correct recent forecasting errors.
Regression analysis is another statistical, computer-based technique, for the modelling and analysis of numerical data, which establishes relationships between multiple variables and predicts them forward. The goal of regression analysis is to predict the values of a dependent variable (for example, cash in the bank) based upon the values of one or more independent variables (for example, monthly credit sales). In linear regression, the function is a straight-line equation. For example, if the value of an automobile decreases by a constant amount every year after purchase and for each mile it is driven, the linear function would predict the car’s value (the dependent variable) as a function of the two independent variables: age and miles.
An alternative to linear regression is polynomial regression – this uses a nonlinear curve to extrapolate data points. New tools and techniques (such as machine learning) are focusing on this area, given the challenges of forecasting payments and receipts based on complex data sets, which some companies face.
The distribution model looks at total estimated flows for an item and apportions the total cash flows into individual flows over the forecast period in order to estimate daily or monthly cash movements.
The distribution percentages are based on historical patterns and are calculated using one of the statistical methods, such as moving average or regression analysis. As with the moving average, the distribution can also be adjusted to cover cash-flow patterns such as those known to occur at month or quarter ends, certain days of the week, pay day, VAT payment dates, etc. Adjustments might also incorporate seasonal changes. For example, the receivables team may be aware that a certain customer (often public sector) makes large payments towards the end of their accounting year in order to use up their budget, and this may be overlaid as part of the distribution method.
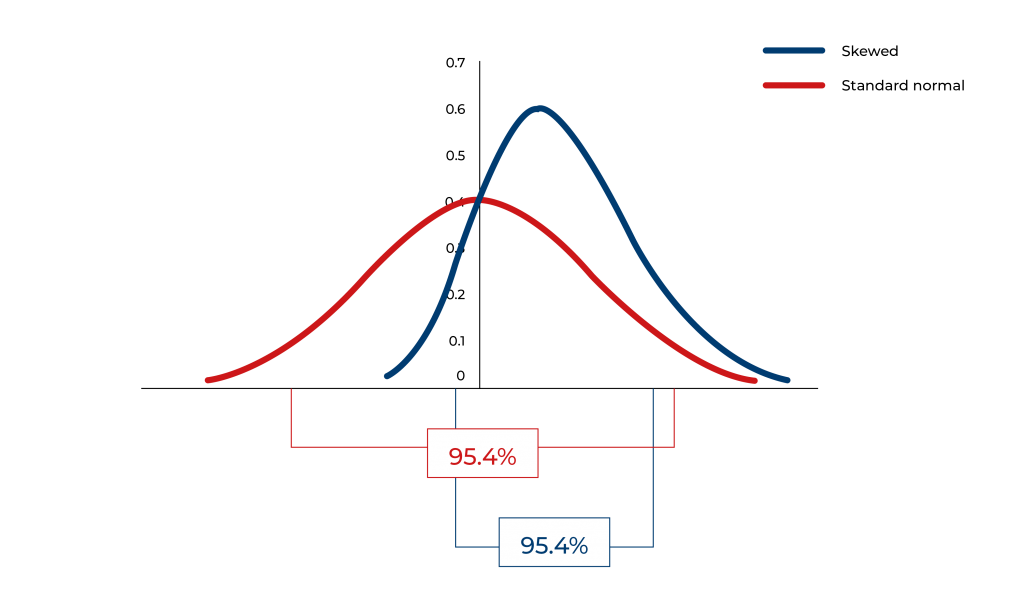
Range forecasting begins with a discussion with those providing the underlying forecast to understand the risks and opportunities of that part of the business. You agree on the most likely outcome, and that point is unlikely to be right in the middle. This forms a statistical probability curve, and you can add up the different parts of your business and then cut off the outlying parts of the overall curve to come up with a reasonable range of outcomes.